Build your reports
A report is made by defining specific sections on a sheet tab, then combining the metrics (columns) and entities (rows) you want for each section.
Choose a sheet tab
Pick the bottom tab in your spreadsheet where the data will actually be written.
Set up sections
A section defines an independent area within a single sheet tab.
Choose metrics (columns)
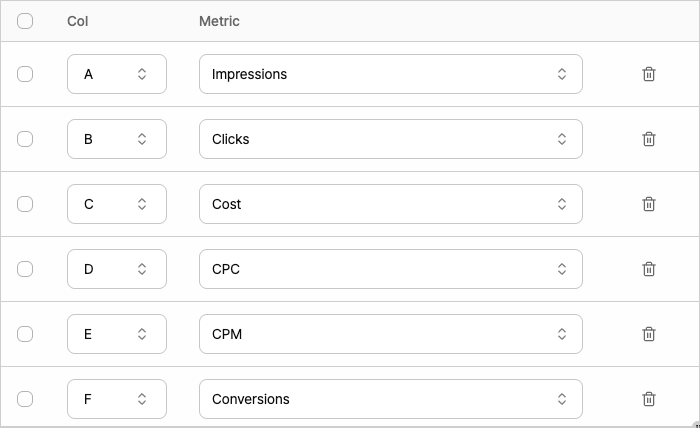
Select the data to display in the columns for this section.
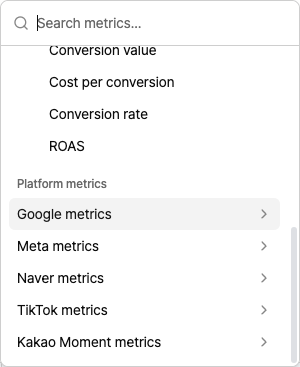
Common metrics: Metrics that work across platforms, regardless of channel.
Platform-specific metrics: Detailed metrics specific to each platform, such as Google · Naver · Meta · Kakao · TikTok.
Set up entities (rows)
Decide how rows are structured for this section and the data range to pull in.
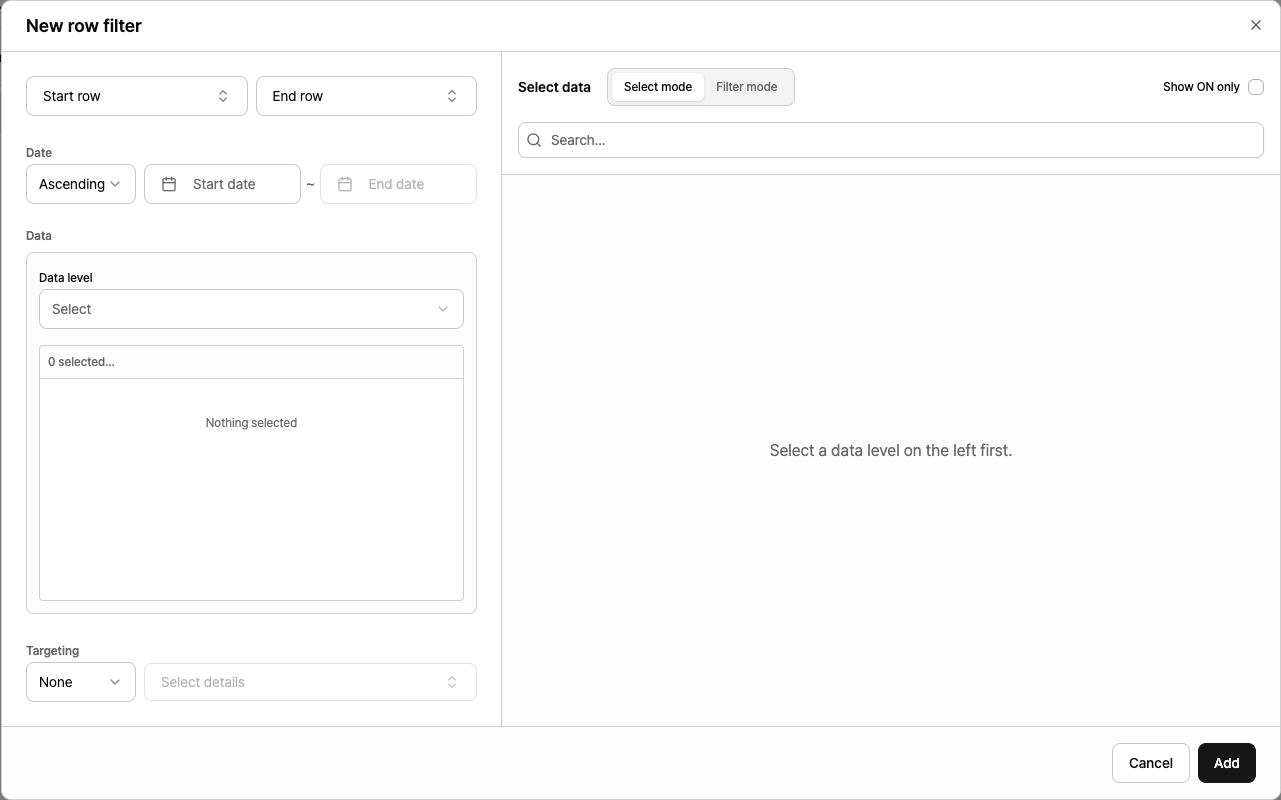
Date settings: Choose how to sort dates (ascending · descending · combined) and set the start date and end date.
Data level (aggregation): Choose one: platform · campaign · ad group · creative.
Apply targeting (segments): If needed, further break down rows by device · gender · age.
Data filtering options (2 types):
Manual selection: Manually check specific campaigns · ad groups · creatives from the tree view.
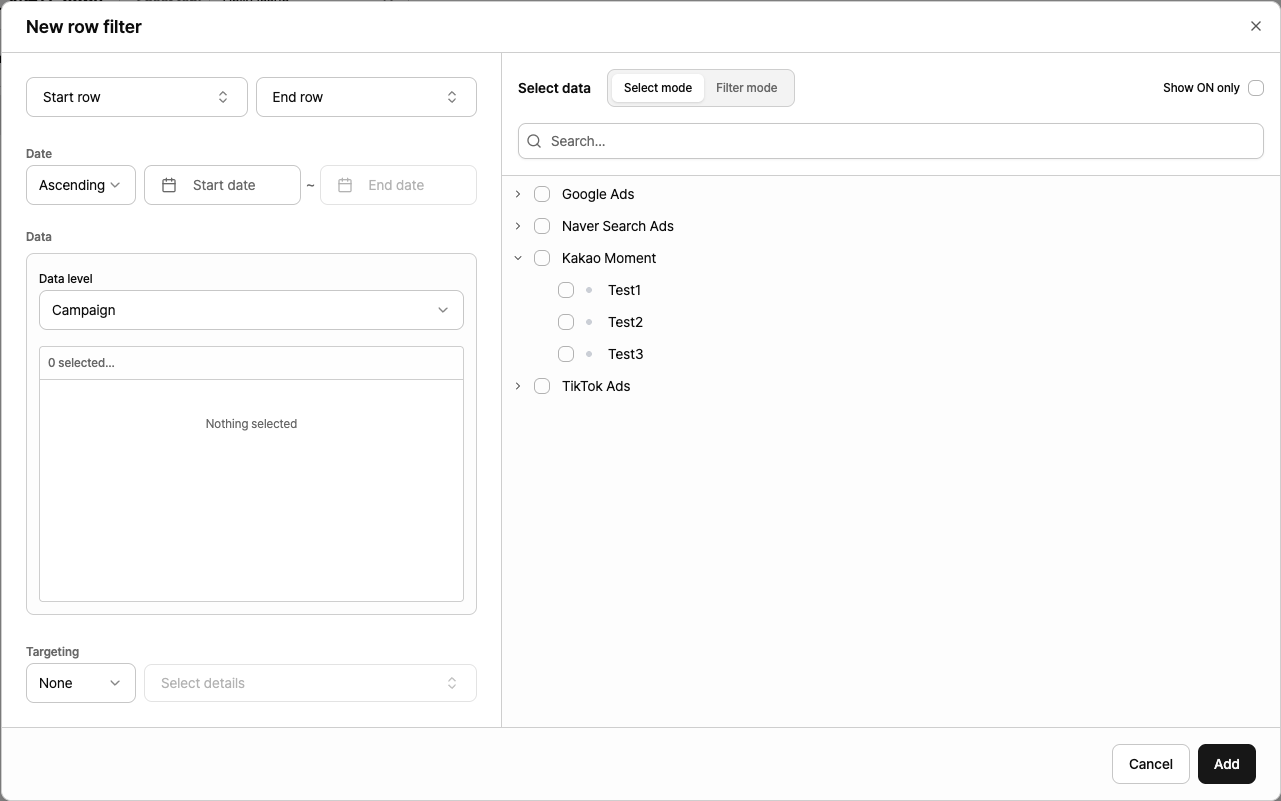
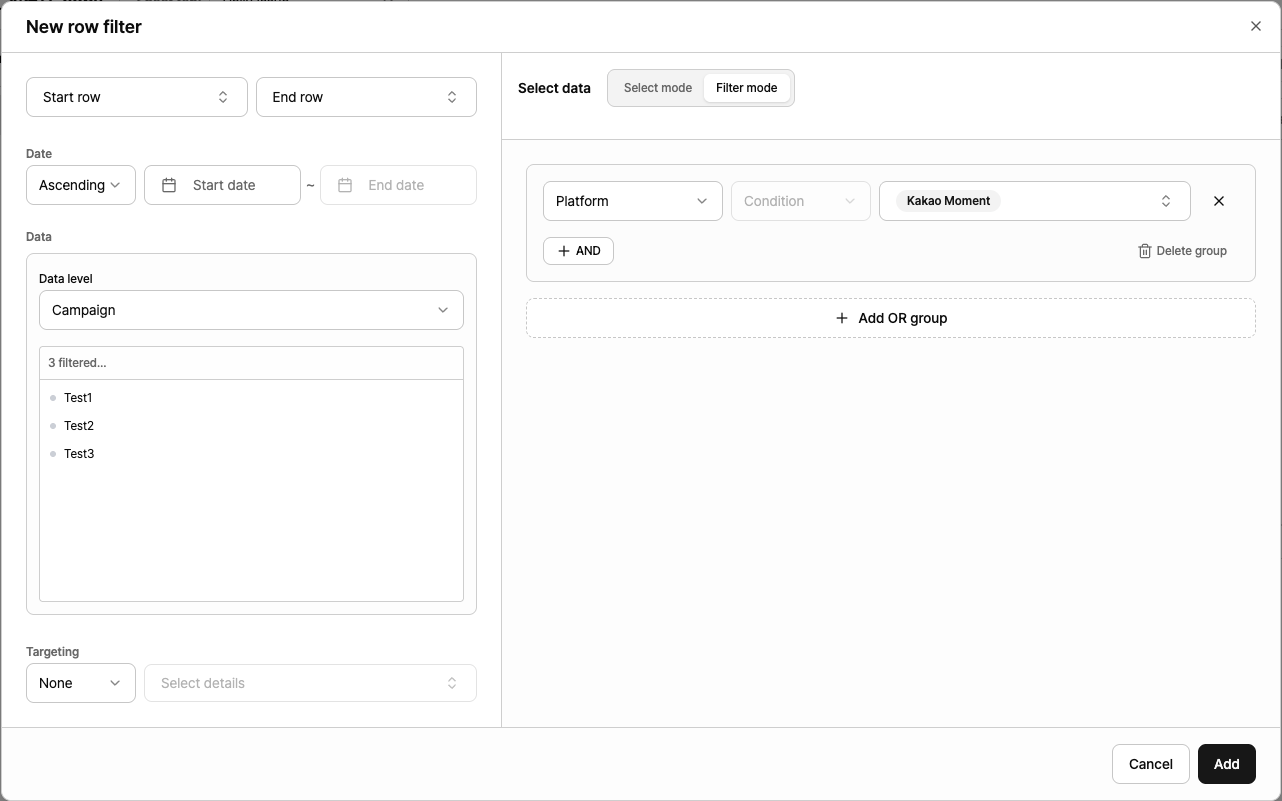
Rule-based filters: Set conditions like name or status to automatically pull in matching entities. Useful when you manage many entities or they change frequently.